
A SESMA Extension · Sensor Coverage Planning
Border Surveillance, Planned on Real Terrain
Border Security extends SESMA with a register of watch sites, cameras and radars, and an engine that shows what each sensor can actually see through terrain, haze and clutter. Find the gaps, test the next tower before it is built, and map where a target could go — on one map, with one audit trail.
D·R·IDetect · Recognise · Identify
9Weather scenarios
4Mobility profiles
Explainer
Border Security explained
A guided walkthrough of the module — from the watch-site register and per-sensor coverage to site search, escape routes and marked reports.
Overview
From a Tower Register to a Defensible Coverage Picture
A tower on a map says little. What matters is what its sensors can see through terrain, weather and clutter, and at what level of detail. Border Security turns the register of sites, cameras and radars into a coverage picture that is recomputed from real elevation data, and uses it to answer the questions that programmes and operations keep asking.
Border Security is a module of SESMA: same deployment, same sign-in, same audit trail.
The Questions It Answers
Which stretch of border is not watched at all? If this tower fails, what do we lose? Where should the next three towers go, and what do they add? If someone is seen here, which sensors see them, and where can they get to in the next twenty minutes? Each question is answered on the same map, from the same register, and every answer can be exported as a report.
Why You Can Defend the Numbers
Every result is computed from terrain elevation, earth curvature, refraction, land cover and weather, never drawn by hand. Ranges are datasheet figures scaled by a realism factor, models stay flagged unverified until tested in the field, and every route is a candidate route, not a prediction. Outputs that reveal where the border is not watched sit behind a separate analyst role.
The Challenge
The Problems Engineers Face in the Field
Engineers who plan and run border surveillance networks are asked simple questions with tools that cannot answer them. Where should the next tower go? What can this camera actually see at night? Where are the blind spots, and what happens if a site goes down?
Siting by trial and error
Candidate sites are shortlisted from maps, site visits and access to power, roads and backhaul, then judged one at a time. The coverage of the network as a whole is rarely computed before construction, so gaps are often discovered only once the towers are in operation — when moving a mast is slow and expensive.
Blind spots a map does not show
A circle on a map hides the ground a sensor cannot see: the far side of a ridge, the floor of a wadi, a river bend, the dead ground just below a crest. Without a computed viewshed, nobody can say how much of a border segment is actually watched, or which stretch goes dark when a single site fails.
Terrain, mast height and earth curvature
A defensible coverage figure depends on the elevation model, the mast height, the height of the target, and the curvature of the earth and refraction at long range. Small errors move the edge of coverage by hundreds of metres, and coarse elevation data loses exactly the gullies where a person on foot can hide.
Vegetation, buildings and clutter
Trees, orchards, crops, reed beds and buildings raise the effective ground along every line of sight and attenuate radar. Clutter is rarely held in a form a planning tool can use, so its effect is usually ignored or guessed.
Datasheet ranges that ignore the weather
Detection, recognition and identification ranges are normally derived under clear-air, high-contrast conditions. Fog, rain, haze and humidity can cut effective range substantially, and visible and thermal channels degrade differently. Coverage drawn from the datasheet alone overstates what a network will deliver.
Technical details scattered across files
Mast heights, sensor models, fields of view, pan and tilt limits, sectors, power and backhaul sit in spreadsheets, drawings and supplier documents that drift out of date. Every study starts by re-establishing what is actually installed.
Answers that have to be defended
Siting and procurement decisions are reviewed by programme boards, evaluators and auditors. A coverage picture that does not state its conditions — target, mast height, time of day, weather and data source — cannot be checked, compared or reproduced.
Capabilities
Key Features
From the register of what exists, to what each sensor sees, to where the next tower should go and where a target could run.
Watch-Site Register
Sites carry cameras and radars, each with boresight, sector, tilt and status (planned, commissioned, decommissioned). CSV import with dry-run preview and export, and a change log that records who changed what, when, before and after.
Coverage by Selection
Tick any combination of sensors and see their coverage at once: best level, radar and camera together, overlap, or which sensor sees each cell best. Per-sensor results are cached, so a new selection redraws in a moment.
Real-World Line of Sight
Terrain elevation, earth curvature and refraction, mast and target height, sensor sector, tilt and minimum range, plus land-cover clutter that lifts the ground: a built-up block or an orchard hides what lies behind it.
Weather & Day / Night
Nine editable scenarios from clear to thick fog, rain and dust storm. Visible and thermal channels degrade by their own physics, and cameras can be run by day, by night or best of both.
Place a Target, See Who Sees It
Drop a what-if target, or open a real one, and drag it. For every sensor you get the level reached, distance and bearing, or the reason it fails: terrain, sector or range. Sight lines are drawn green or red on the map.
Scenarios & Gain Analysis
Propose new towers or take existing ones out in a scenario that never touches the register. Compare baseline against proposal with a delta map and a gain table, then let an administrator promote what is accepted.
Site Search
Ask where the next N towers should go. The engine scans candidate locations and terrain high points, picks the sites with the greatest added coverage, and re-checks each choice sensor by sensor before it is reported.
Escape Routes
From any target or map point: isochrones for how far it can be by now, diverse candidate routes with ETA and slope, a corridor of near-best alternatives, the sensors along each route, and interception points for responders.
Border-Line Reports
For analysts: percentage of the border covered at each level, the list of gaps with lengths, a dead-ground map and each site’s unique contribution. Every output is watermarked and exports to CSV or KML.
Platform in Action
Screens from the Working Module
Every screen below is the live Border Security interface, shown with demonstration data: a register of more than a hundred watch sites along a national border. They run in the order a programme uses them: know what you have, see what it sees, plan what is missing, anticipate what moves, and report.
01Know what you have
The Border Security room
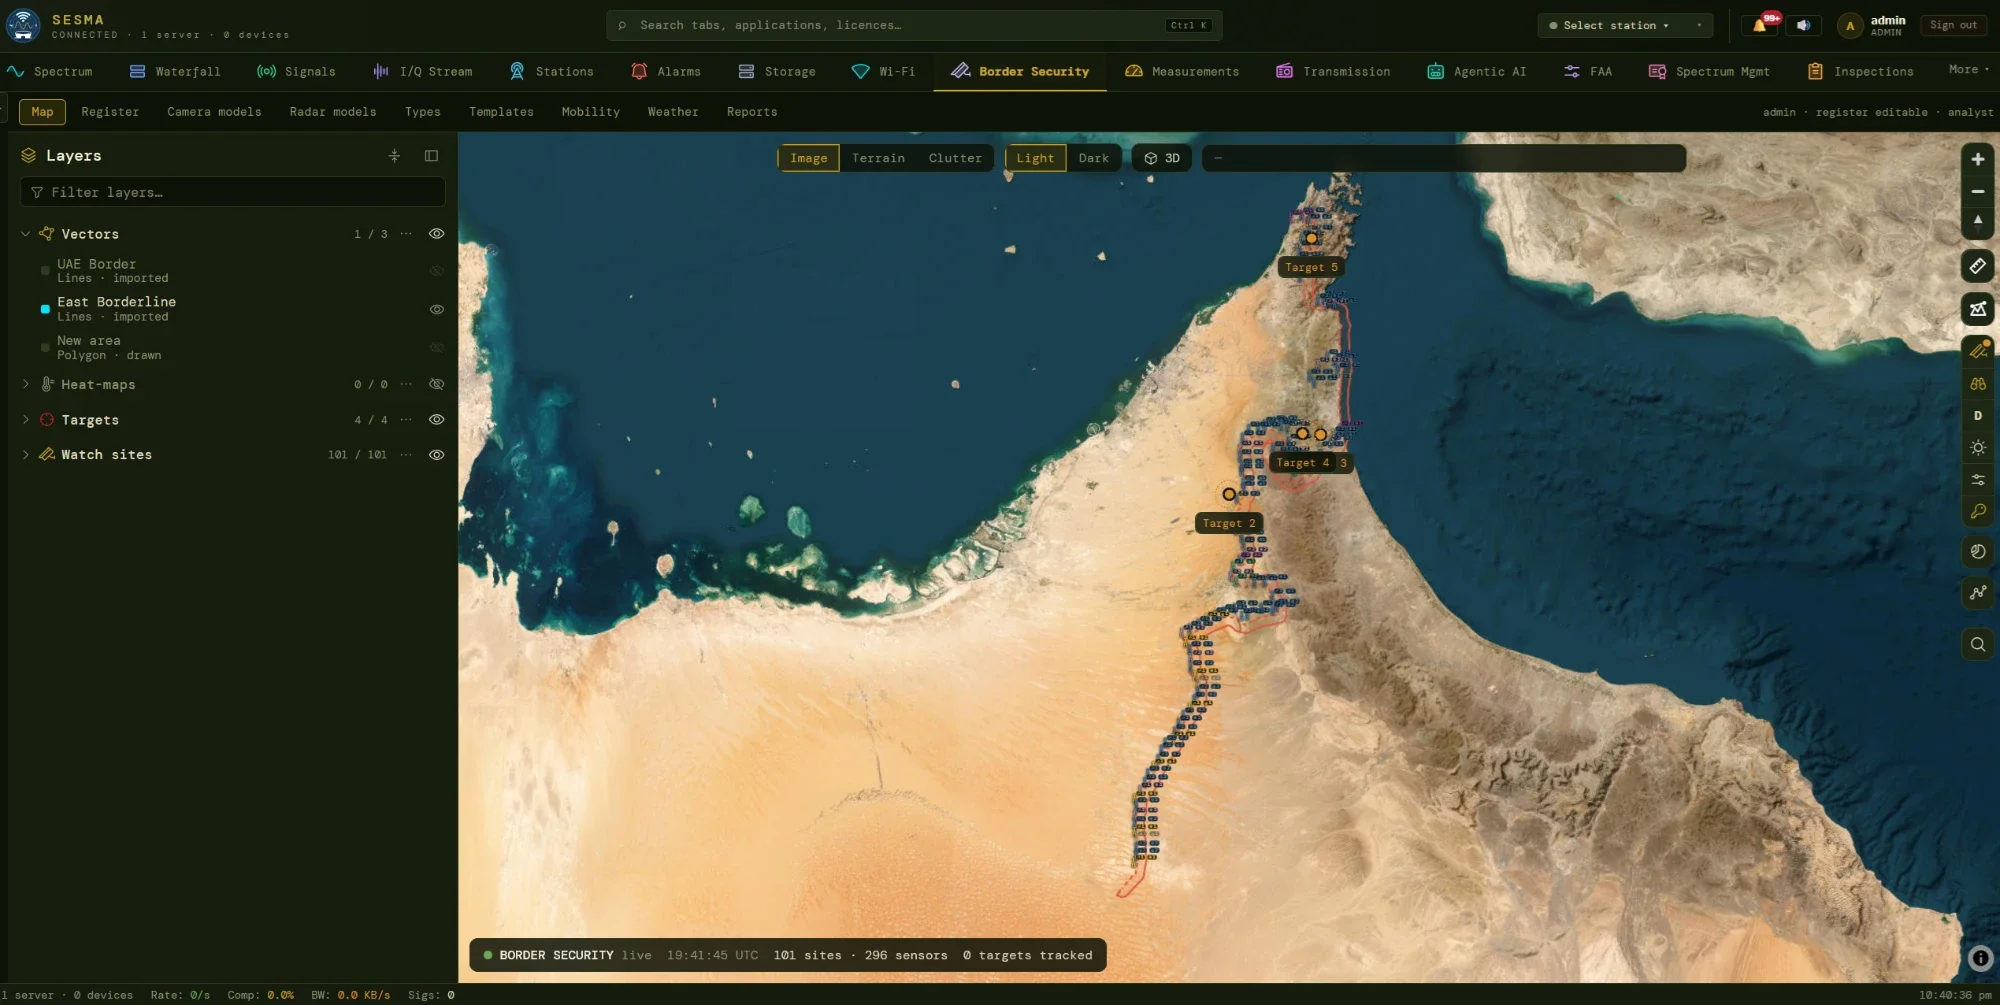
One map for every tower, camera and radar
The module opens on its own room, separate from the spectrum Mission Room and open only to Border Security holders. Layers organise the picture: vectors (border lines, barriers, tracks), heat-maps, targets and watch sites. The status bar counts what is on the map, and everything a user draws or places stays inside this room.
- Backdrops of imagery, terrain or clutter, light or dark, and one global 2D / 3D switch.
- Site markers take the colour of their site type; a solid mast is commissioned, dashed is planned, grey is decommissioned.
- Border lines and areas are imported or drawn on the map and reused by every analysis.
- Nothing is shared with the Mission Room: targets, vectors, heat-maps and preferences are the room’s own.
Register
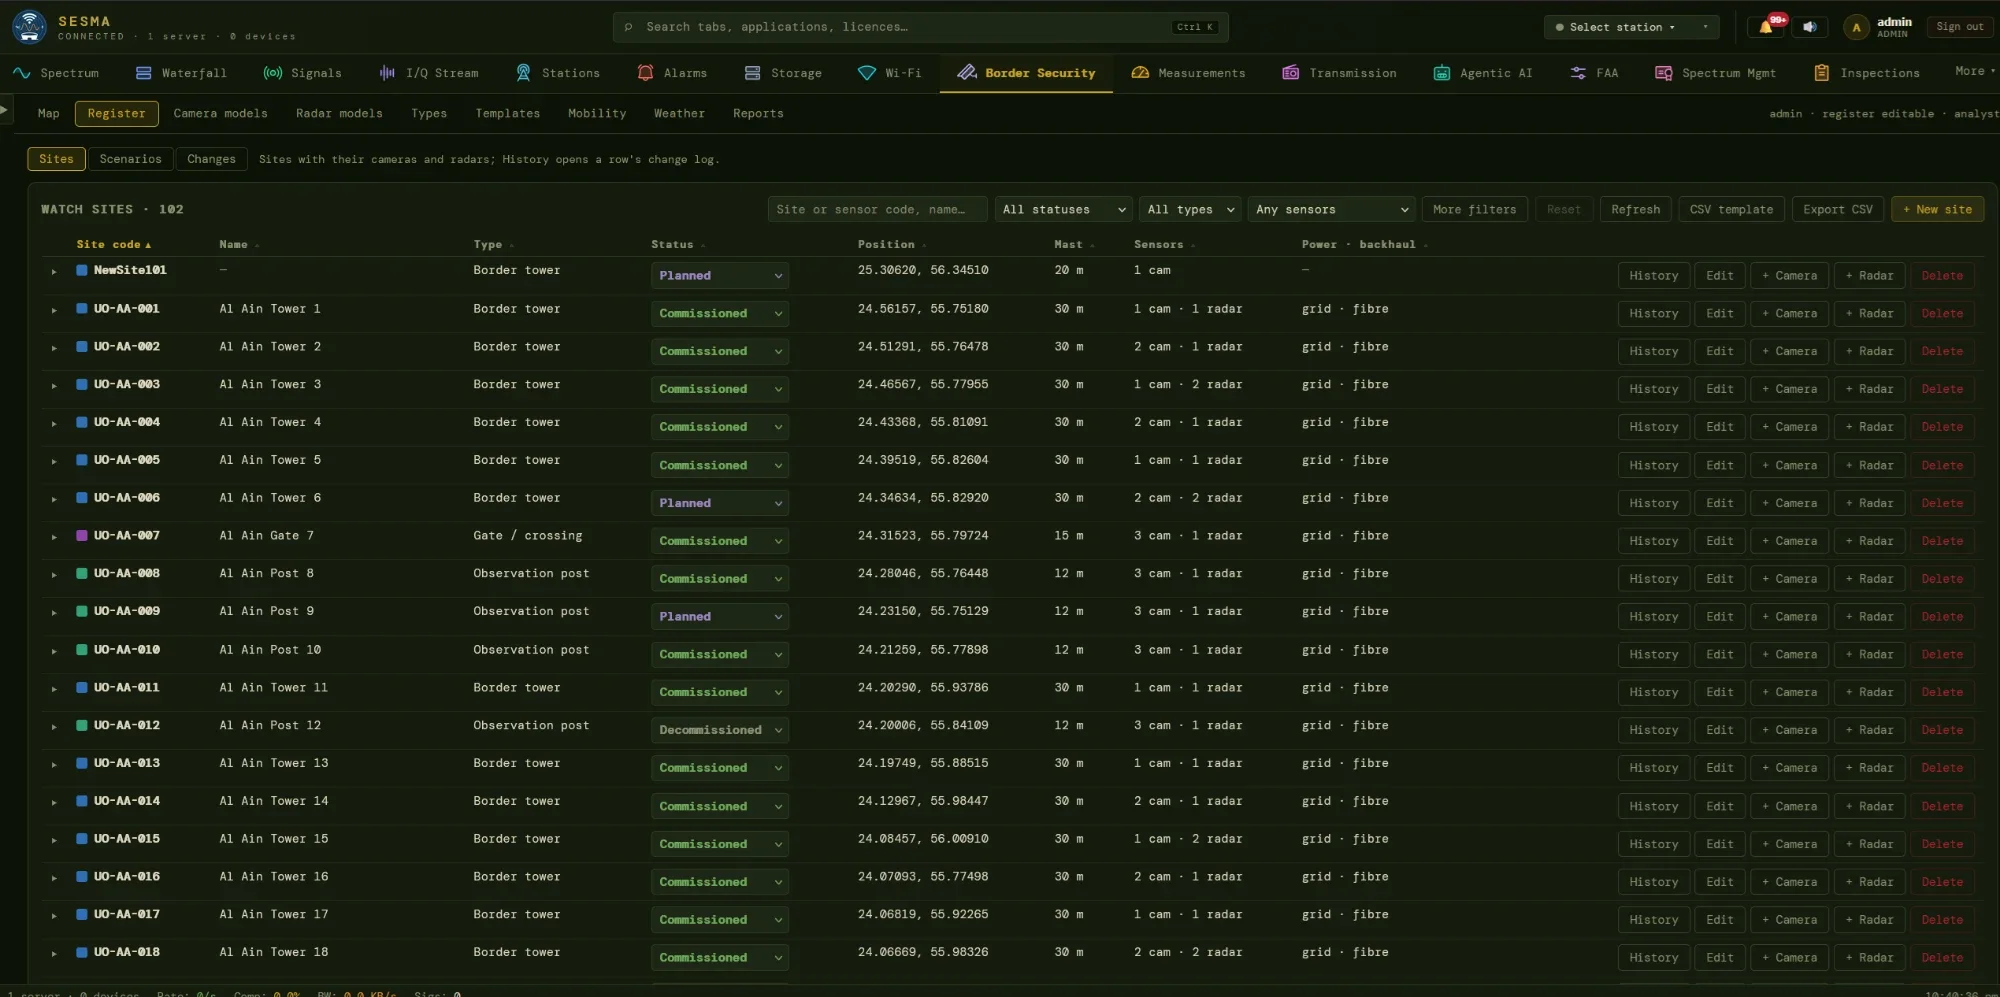
A register that remembers every change
The register is the single list of what is built, planned or retired. Each row is a site; open it to see its cameras and radars. Everyone with the module can read it, administrators edit it, and every edit leaves a trail, so a coverage figure can always be traced back to the configuration it was computed from.
- Filter and search by status, site type, sensor kind, model, capability or distance from a point; sort on any column.
- Inline status changes move a site between planned, commissioned and decommissioned.
- CSV import with a dry-run preview of every row (new, update, unchanged, error) before anything is committed, and CSV export in the same format.
- Change log: who, when, which field, before and after; History on any row opens it narrowed to that site or sensor.
02See what the sensors see
Tick the sensors, choose a view, set the conditions
Coverage is not run per study. Each sensor’s result is computed once and cached; whatever you tick is composed on the fly. The tree holds the sites, the three controls below decide what you see.
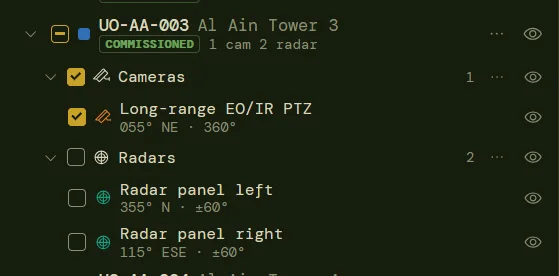
Site, then cameras and radars
Each sensor shows its boresight, compass point and sector (for example 355° N ±60°). Tri-state ticks select sensors at any level; eye toggles only show or hide them on the map.
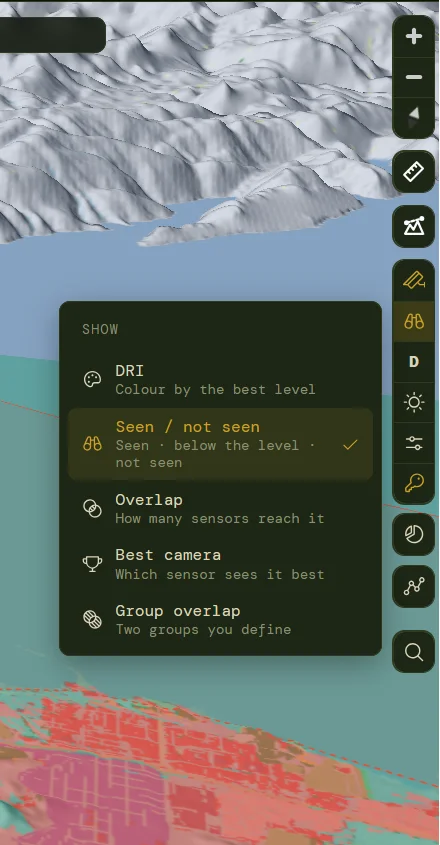
Five ways to read coverage
Colour by best level (DRI), seen or not seen, how many sensors reach a cell, which camera sees it best, or the overlap between two groups you define.
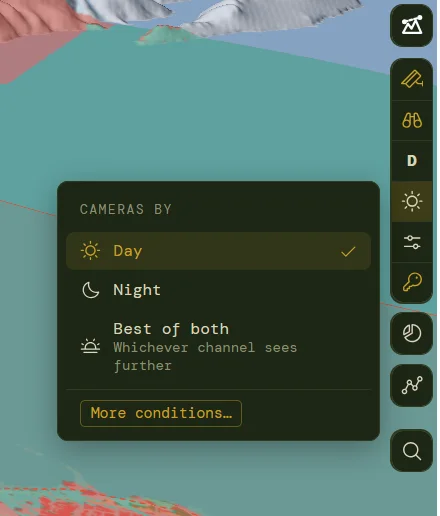
Day, night or best of both
Dual EO/IR heads are one sensor with two channels. A run picks the day channel, the night channel, or whichever sees further.
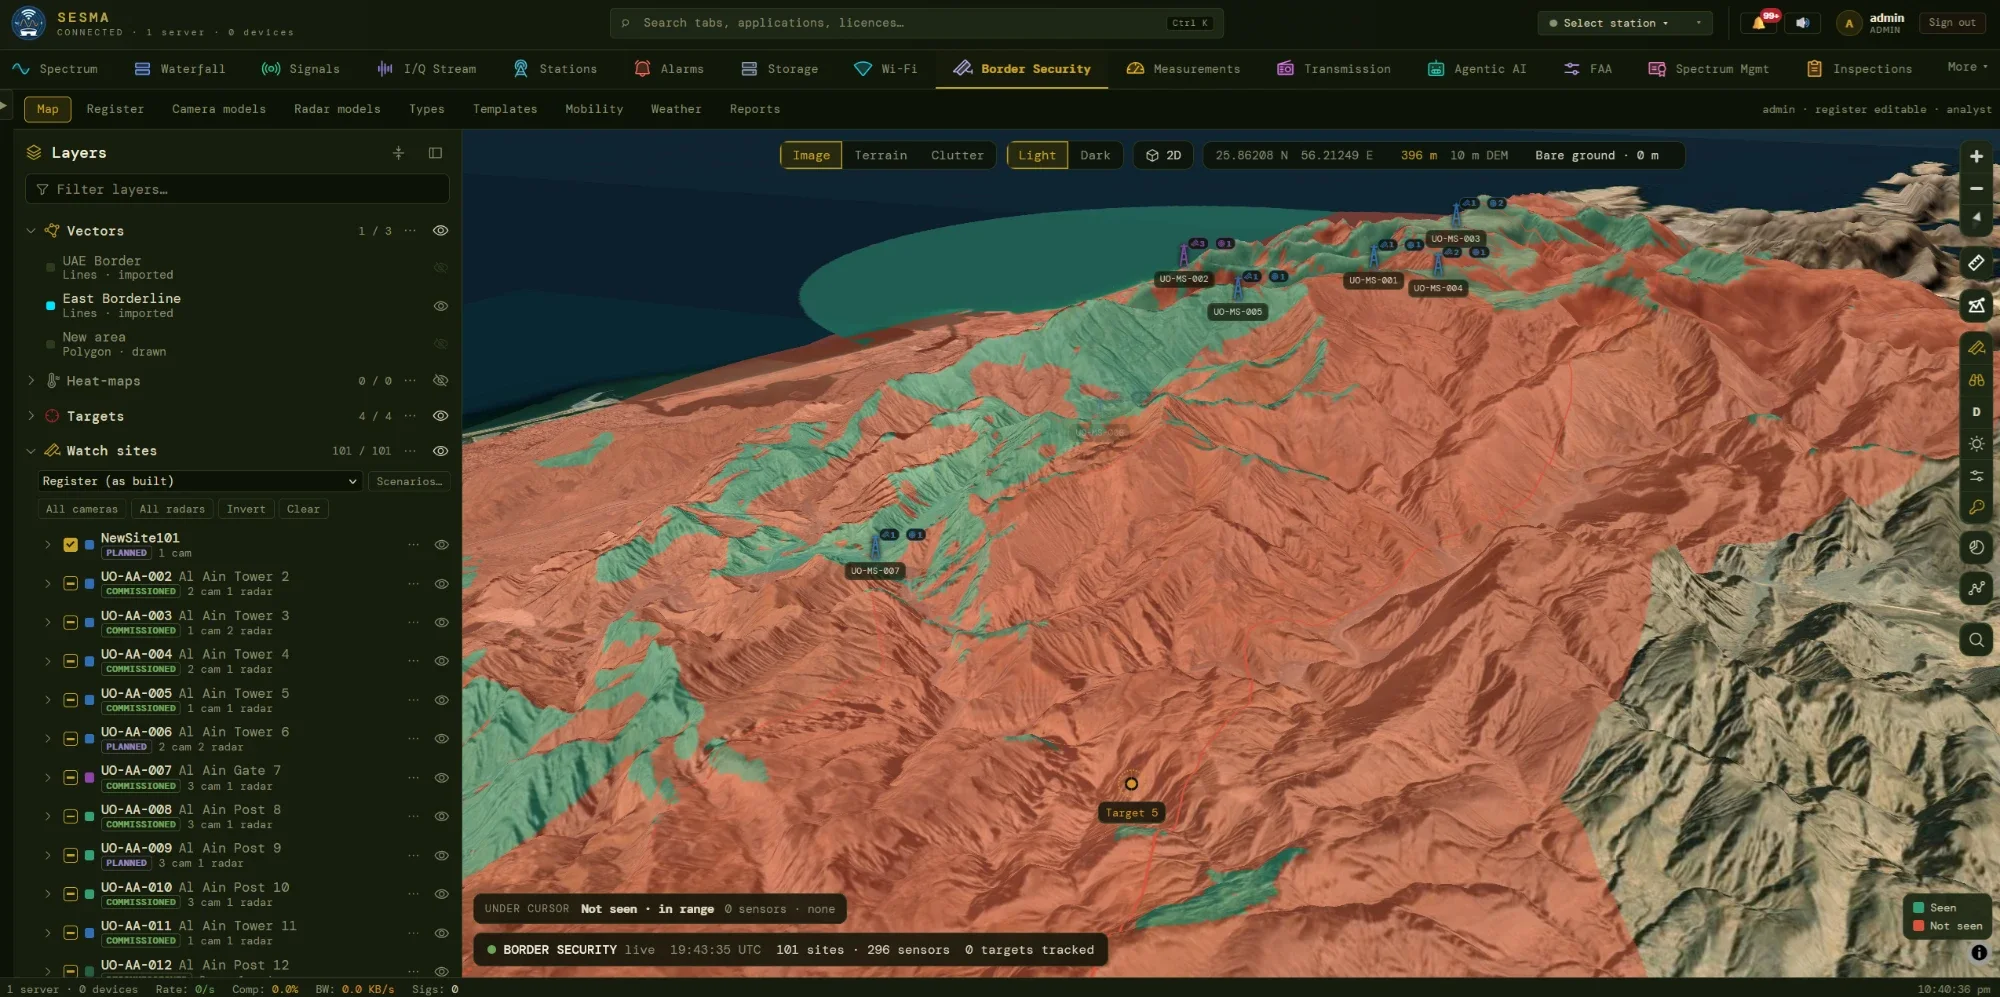
Coverage
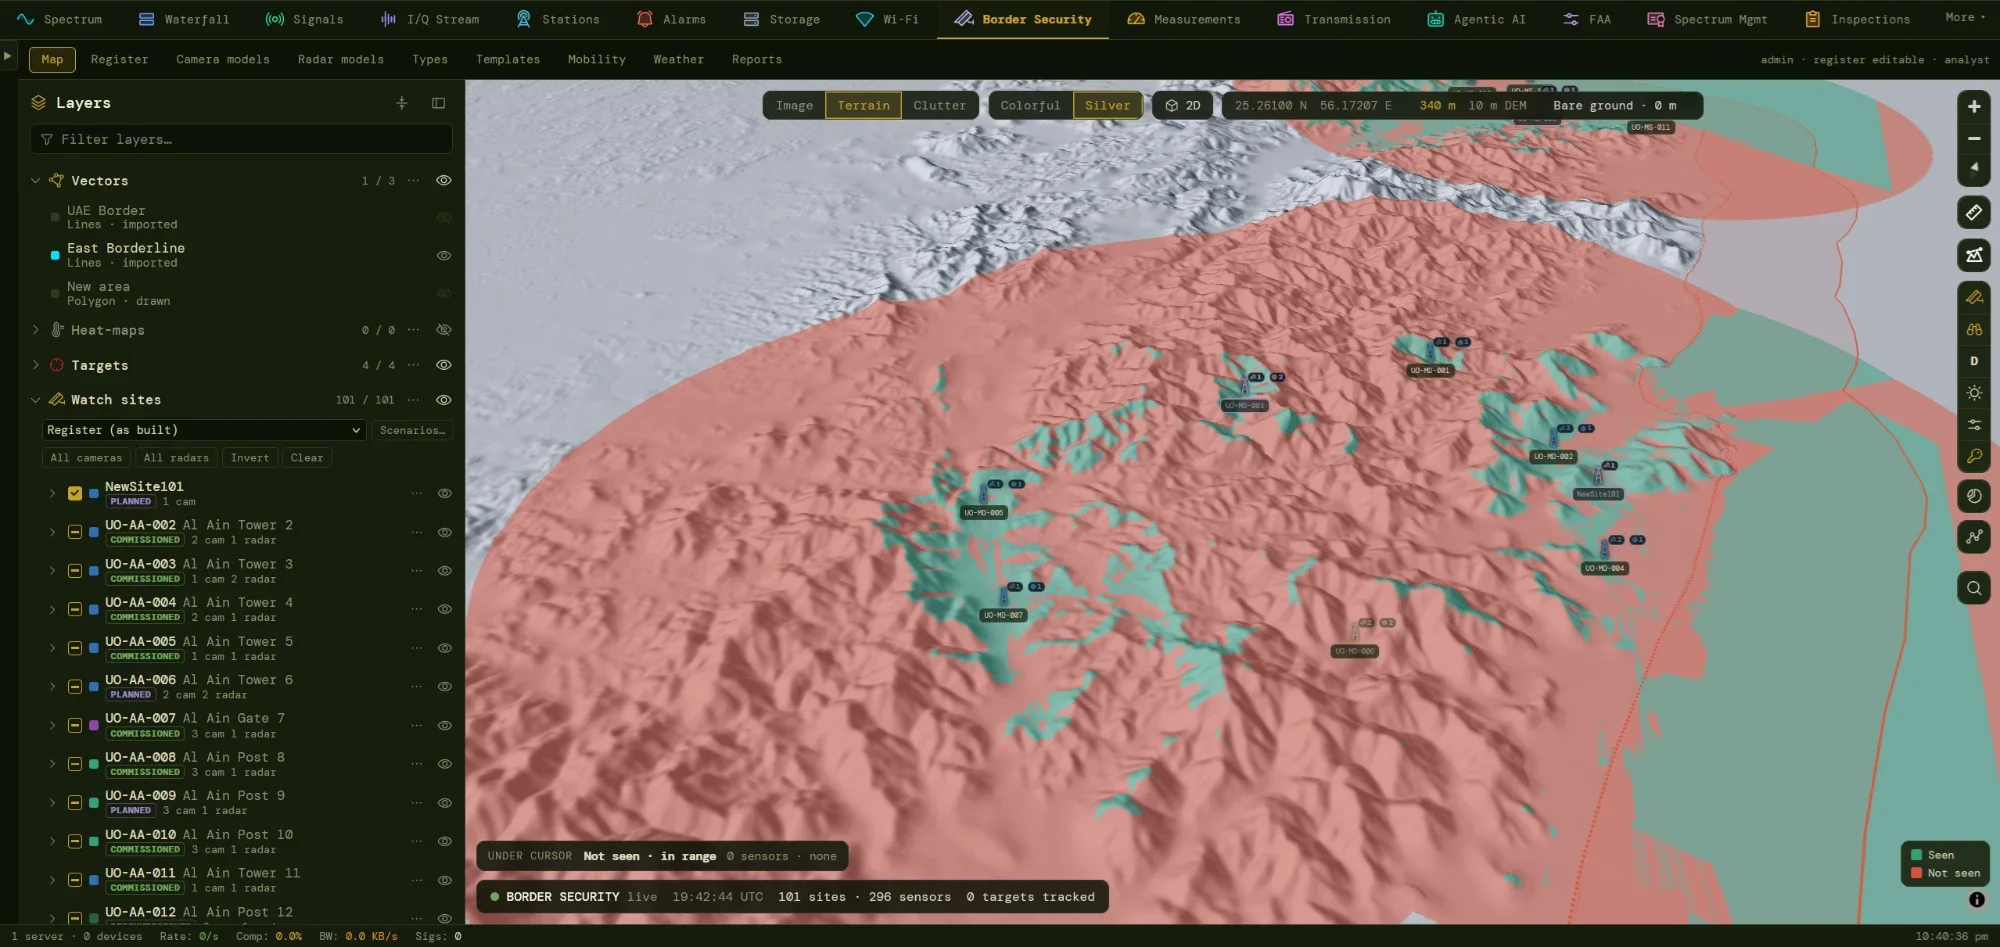
Seen or not seen: coverage that follows the terrain
Teal ground is seen at the chosen level, red ground is not. Each sensor’s view is a radial sweep over the elevation model, with the earth’s curvature and refraction applied, so a ridge casts a real shadow and a near blind zone appears under a down-looking camera. Switch the backdrop and the same result reads against imagery, terrain or land cover.
- Mast and target height are explicit: 0.5 m for a person crawling, 1.8 m standing, 2.3 m for a vehicle.
- Sector, tilt and minimum range are applied per sensor, including sectors that wrap through north.
- Cached per sensor, keyed on every input and the terrain version, so editing one sensor recomputes only that sensor.
- Under-cursor read-out names the level reached and the best sensor at any point.
Run conditions
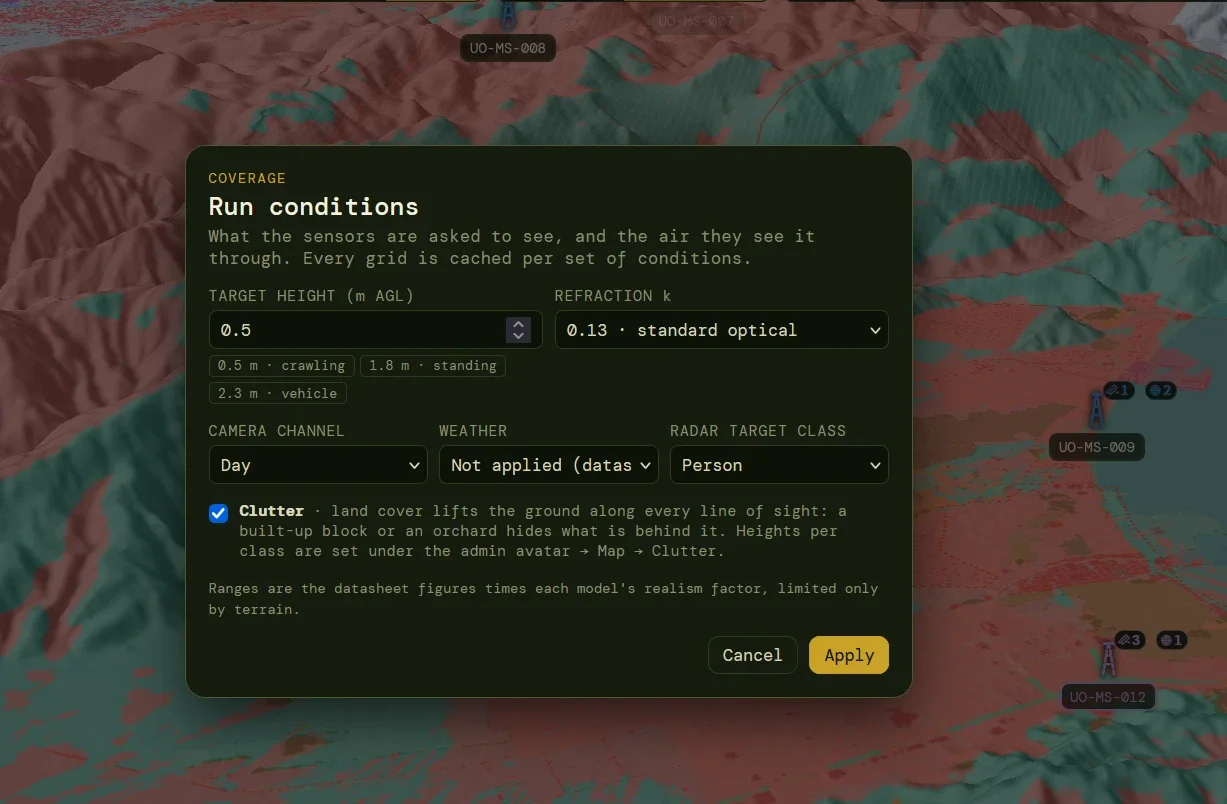
State the question, and the grid is cached for it
A coverage figure means nothing without its conditions. The dialog sets them in one place, and every cached grid is stored against that exact set, so two analysts asking the same question get the same answer instantly.
- Target height with one-click presets, and refraction (standard optical 0.13, hot day, night inversion).
- Camera channel, weather scenario and radar target class (person, vehicle and others).
- Clutter switch: land cover lifts the ground along every line of sight.
- Honest ranges: datasheet figures times each model’s realism factor, limited only by terrain.
Weather
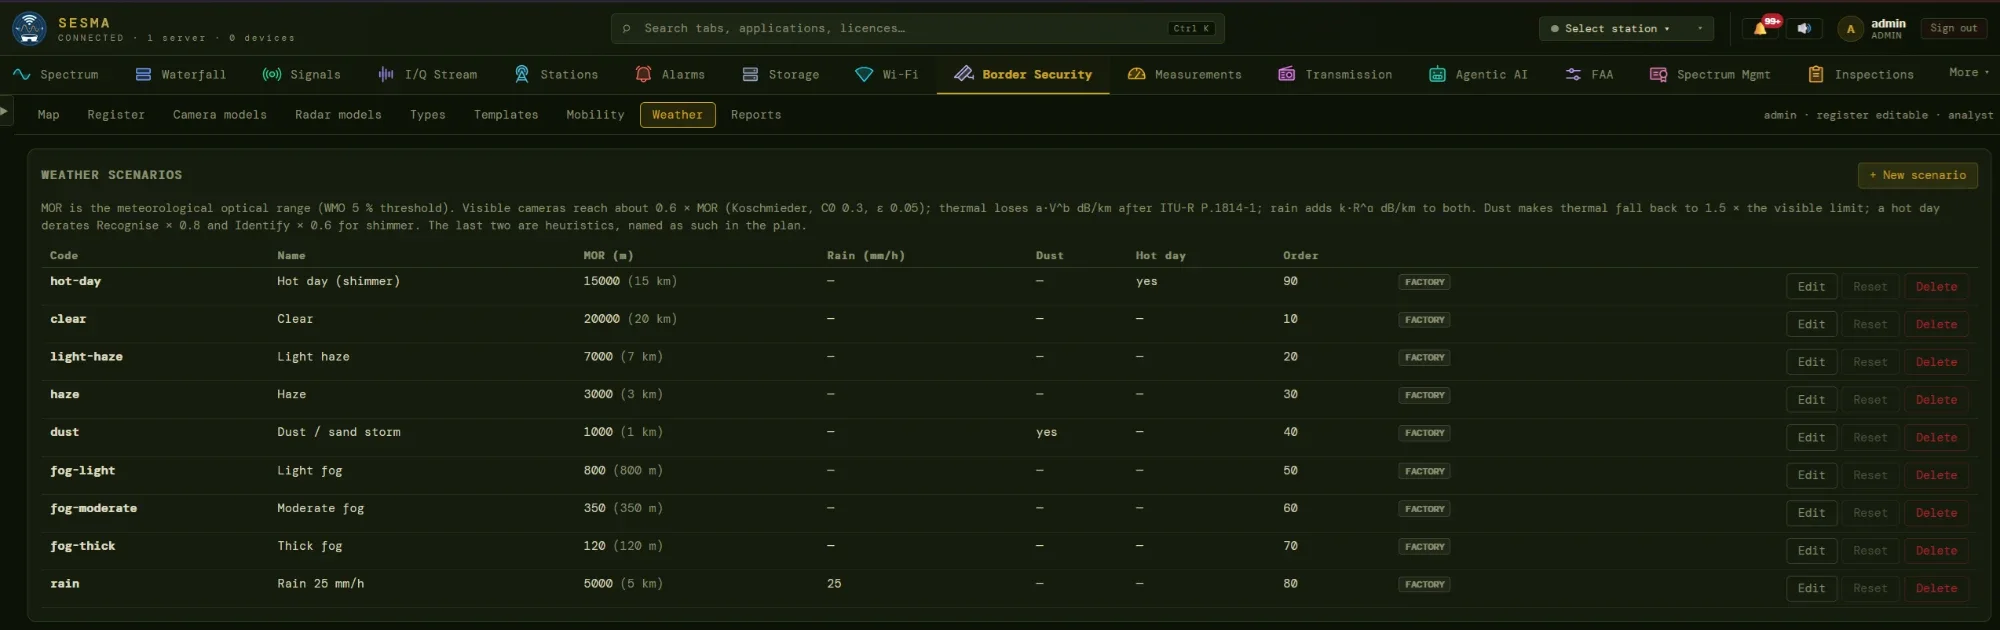
Weather that behaves like weather
Each scenario is a meteorological optical range, plus an optional rain rate and a hot-day flag: from clear at 20 km, through haze, dust and fog, down to thick fog at 120 m. Weather caps every level at the same distance, so Detect, which reaches furthest, is the first to shrink.
- Visible and near-infrared follow Koschmieder visibility, about 0.6 × the optical range.
- Thermal uses ITU-R P.1814-1 fog attenuation, so it holds up in haze but not in thick fog.
- Rain and dust are modelled, and a hot-day shimmer rule derates Identify and Recognise. Heuristic rules are labelled as such.
- Manual factors per scenario override physics where vendor tests or field results exist.
Clutter
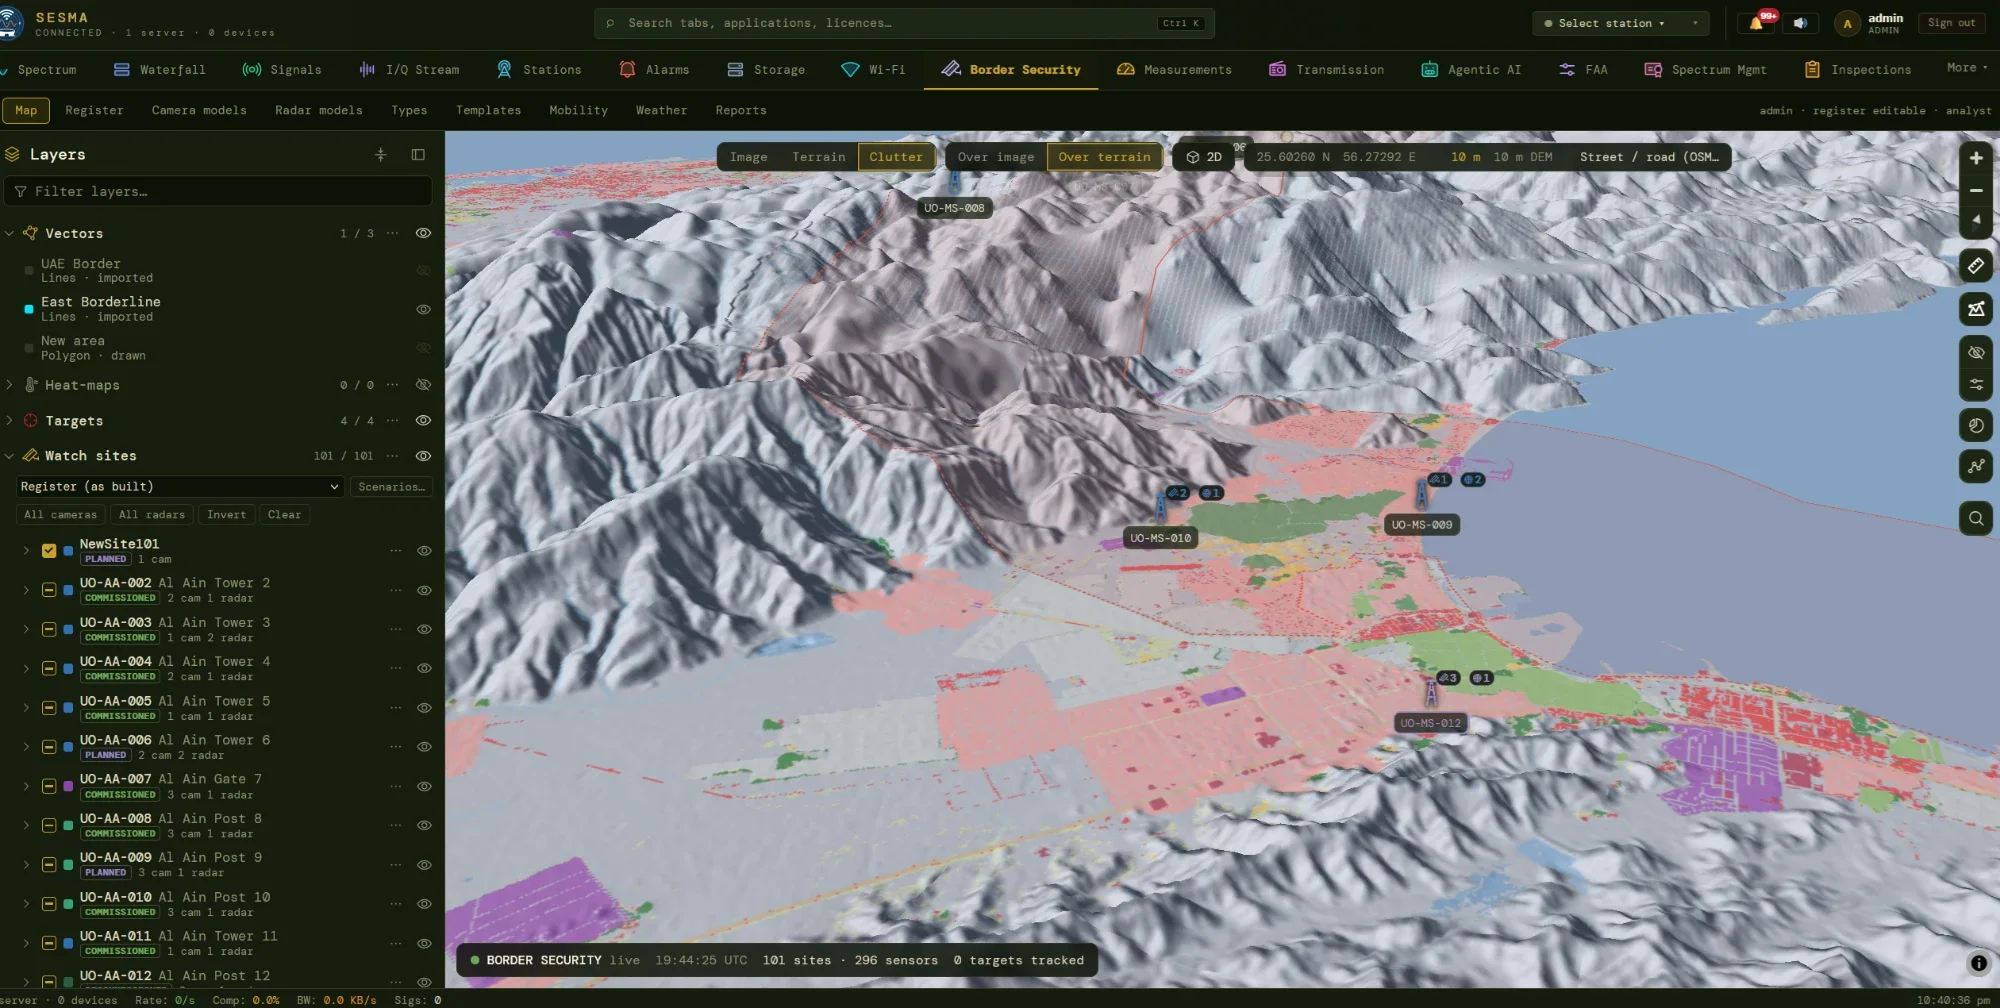
Buildings and trees block sight lines too
Terrain is the main obstacle; clutter is what stands on it. A 10 m land-cover raster and an editable class-to-height table lift the ground along every line of sight, so a town or a plantation hides what lies behind it. Roads and tracks are burned in from OpenStreetMap so a narrow road does not become a false wall.
- Used everywhere: coverage, who-sees-it, dead ground, site search and the terrain profile.
- Cursor read-out names the class under the pointer and the height it adds.
- Sensor and target stand on the ground; only the stretch between them carries clutter.
- Stated limits: a class height is a statistic, the land cover is dated, vegetation is treated as opaque.
Terrain profile
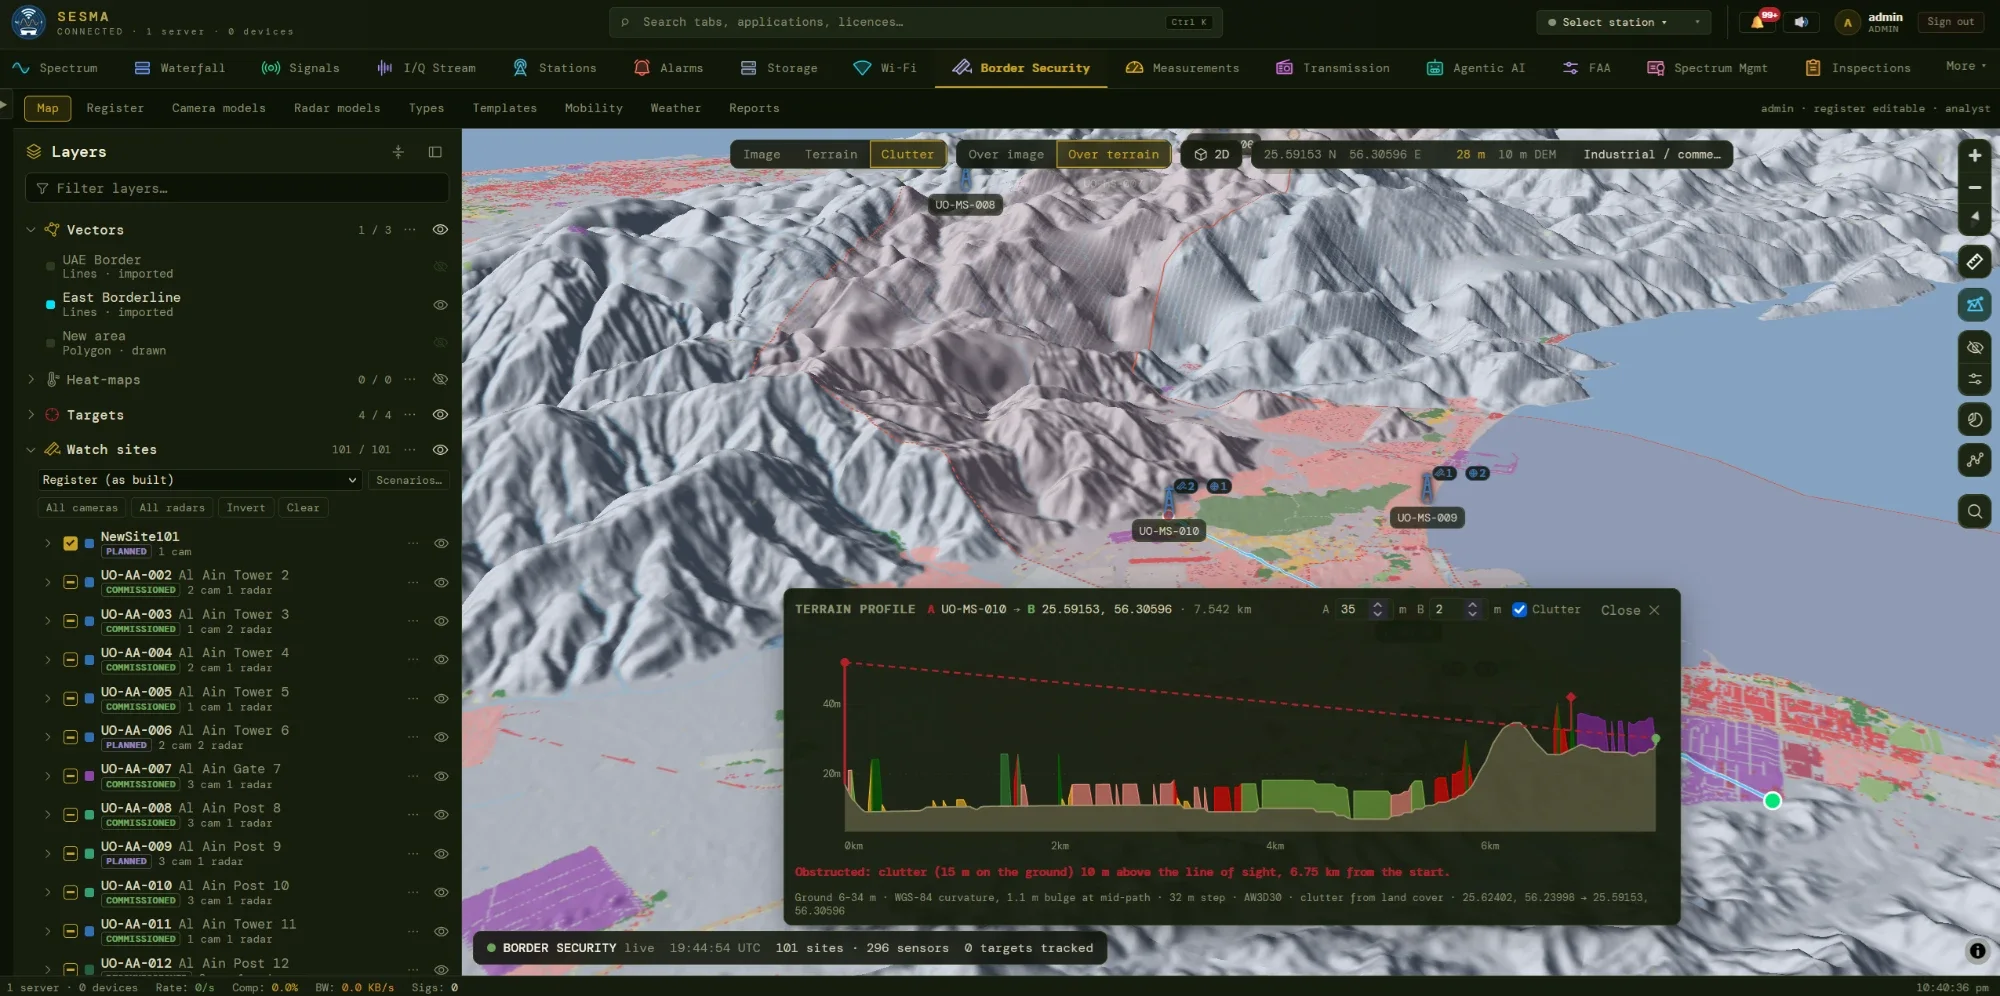
When a sensor cannot see, the profile says why
Click two points on the map, or snap to a site, and the profile appears: ground, curvature, the straight line of sight, the closest approach and a plain verdict. In the example the sight line is blocked by clutter standing 15 m on the ground, 10 m above the line of sight.
- Editable heights at both ends; a snapped site starts at its mast height.
- Clutter drawn as a band, so the obstruction is visible, not just reported.
- Right-click undoes a point, Esc clears, and a new click starts another cut.
- Geometry only: it answers line of sight, not radio propagation, and is available in every room.
03Plan what is missing
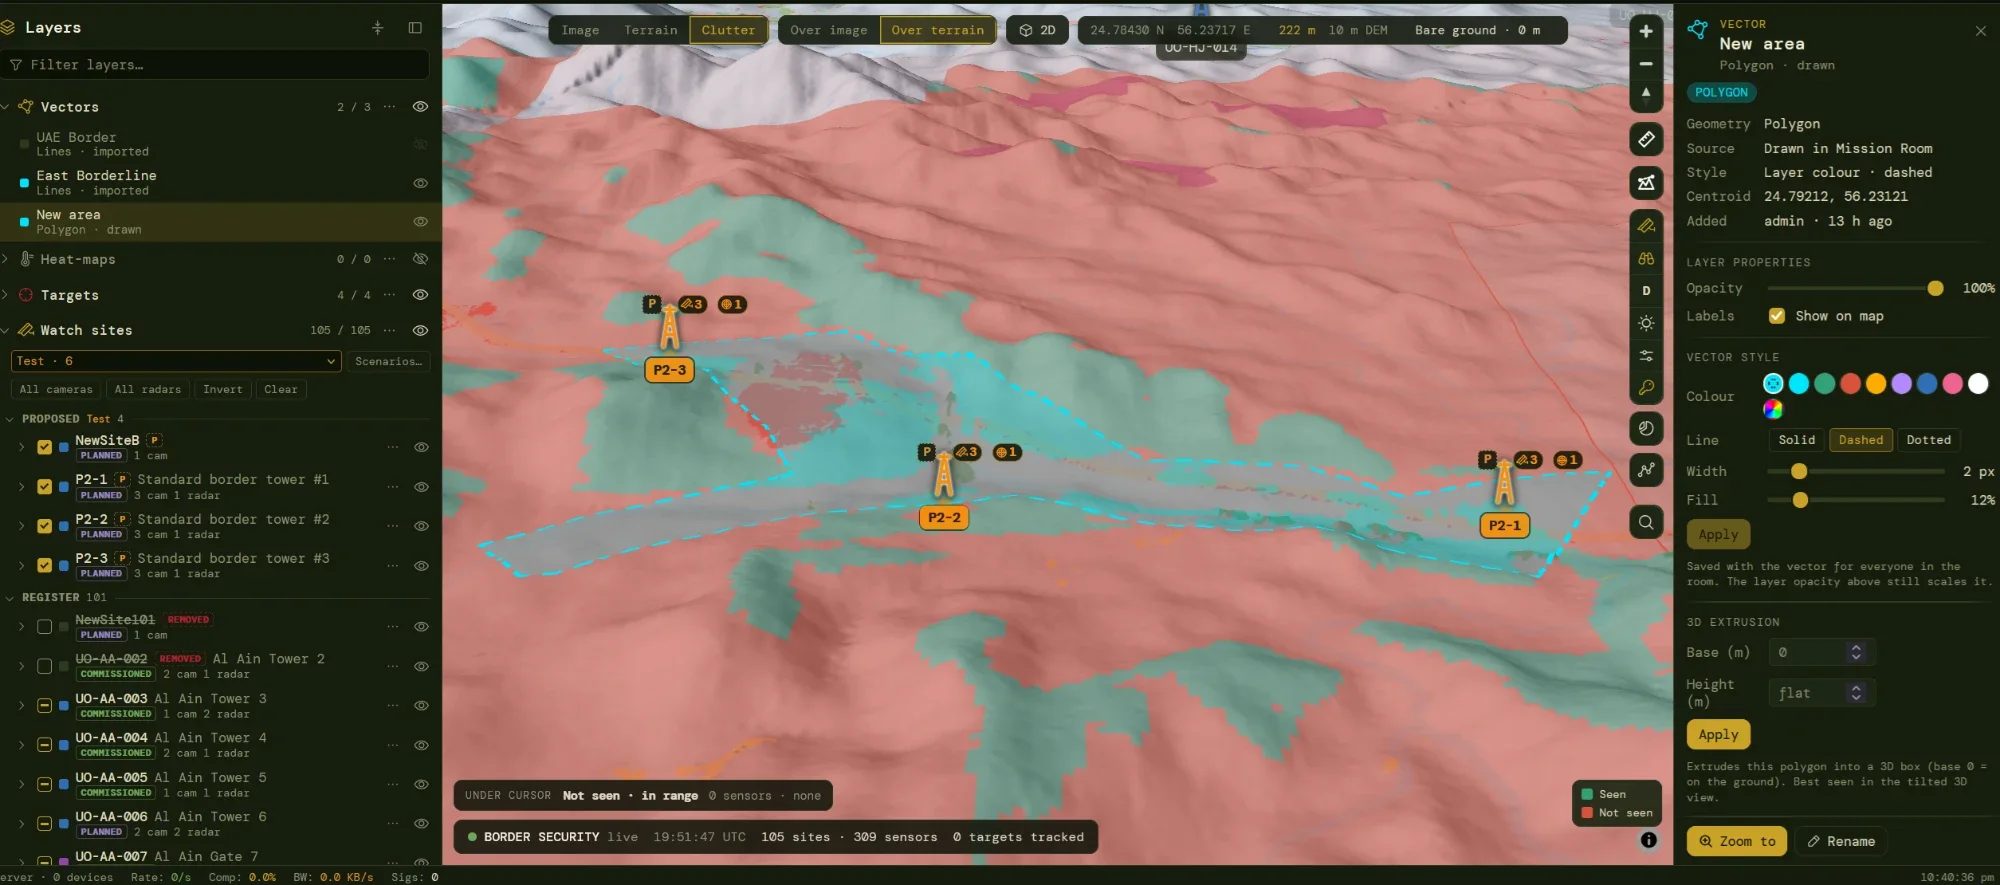
Scenarios and site templates
Propose towers without touching the register
The register holds what is real or approved. A scenario is a named what-if workspace on top of it: proposed sites, or changes to existing ones, such as taking a tower out to see what its failure costs. Proposals are drawn as ghosts with a P badge, so they are never mistaken for built equipment.
- Site templates place a whole kit at once (radar panels, a long-range EO/IR PTZ, thermal cameras) around a reference bearing you rotate on the map.
- Any Border Security user can create and share scenarios; an administrator promotes accepted proposals into the register as planned.
- Delta view and gain table compare baseline with proposal: area gained, improved, lost or degraded, redundancy, and what only the new site sees.
- Optional cost per template: when set, the gain table reports new coverage per 1,000 of cost.
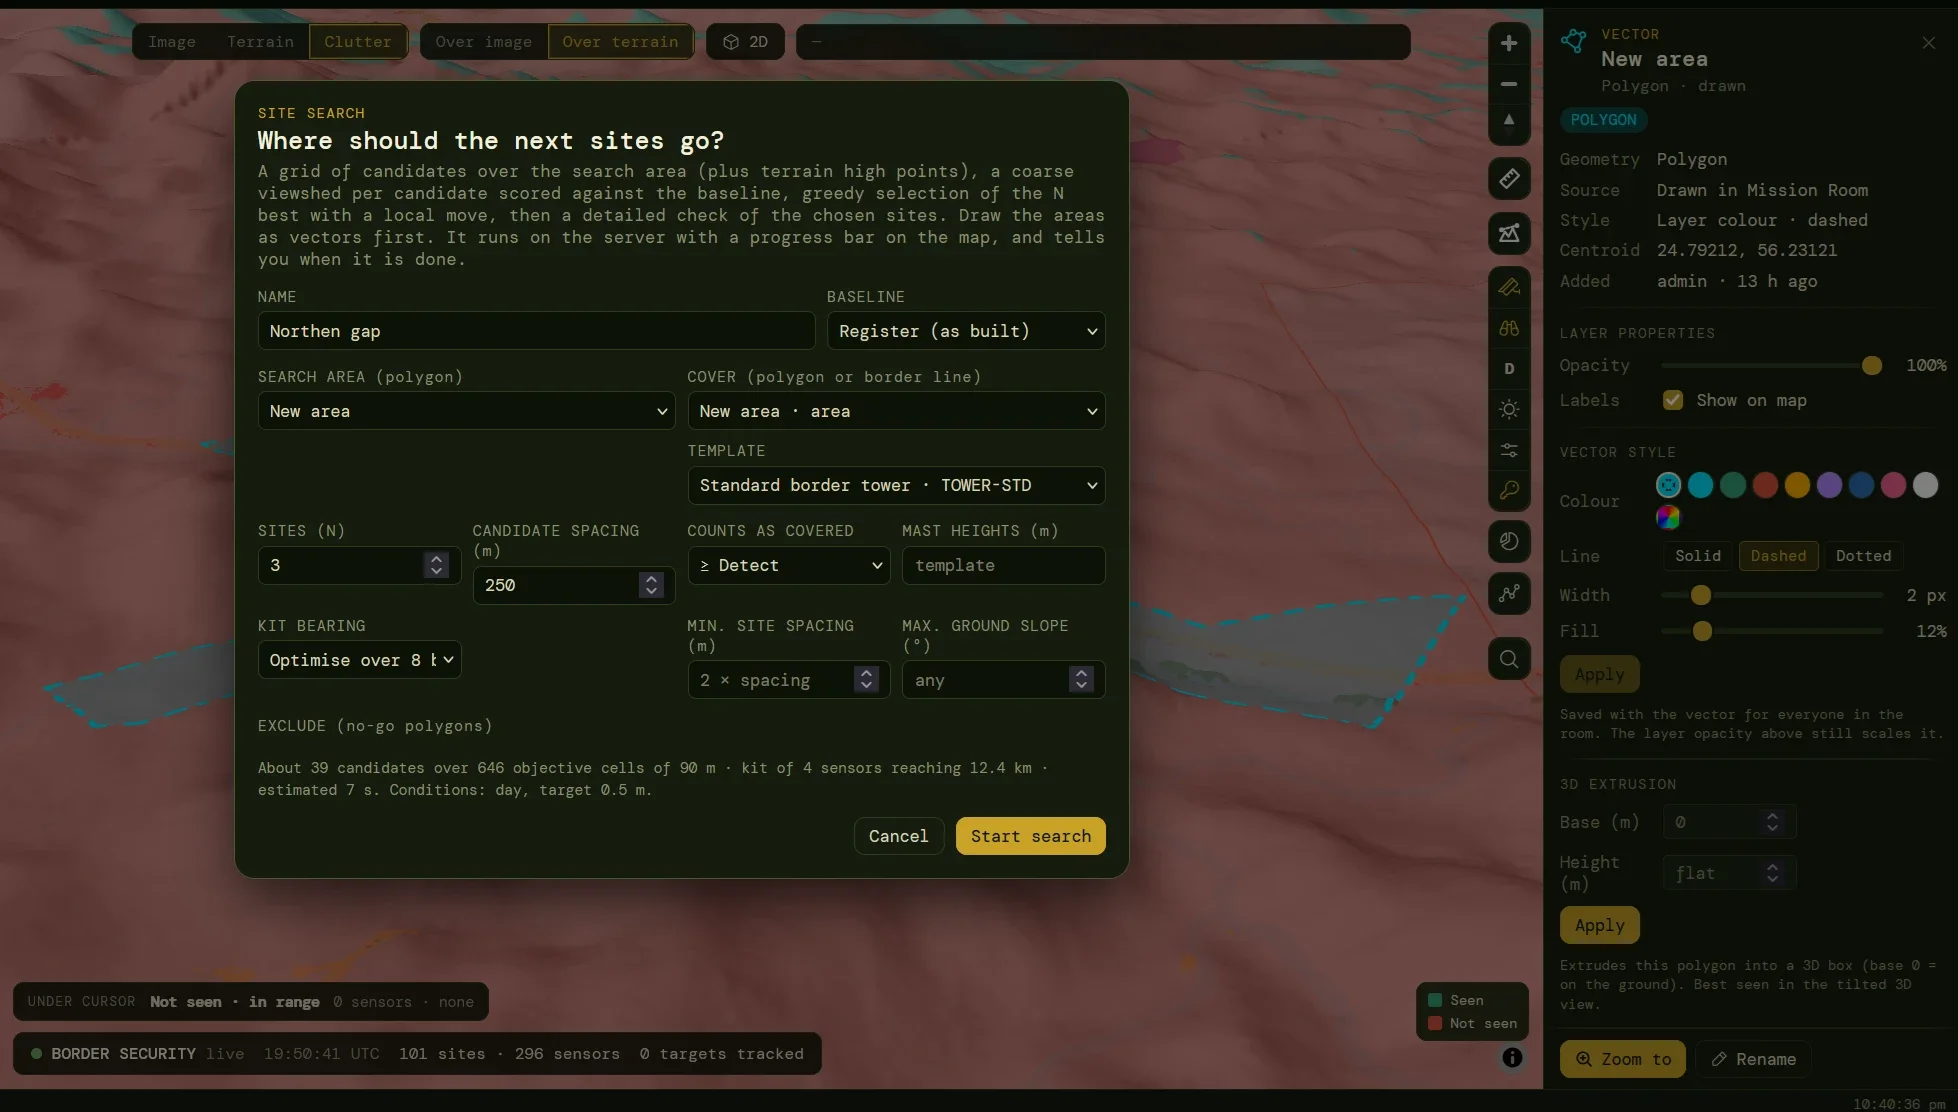
Site search
Where should the next sites go?
Draw the area to search and the area, or border line, to cover. Choose the kit, how many sites, and what counts as covered. The dialog shows the size of the problem before it starts: candidates, objective cells, the reach of the kit and an estimated run time.
- Constraints are optional: spacing between sites, maximum ground slope, candidate mast heights, exclusion polygons.
- Kit bearing is fixed or optimised over eight directions.
- Baseline is the register or an open scenario, so only the added coverage counts.
- Runs on the server with progress on the map, and can be cancelled at any time.
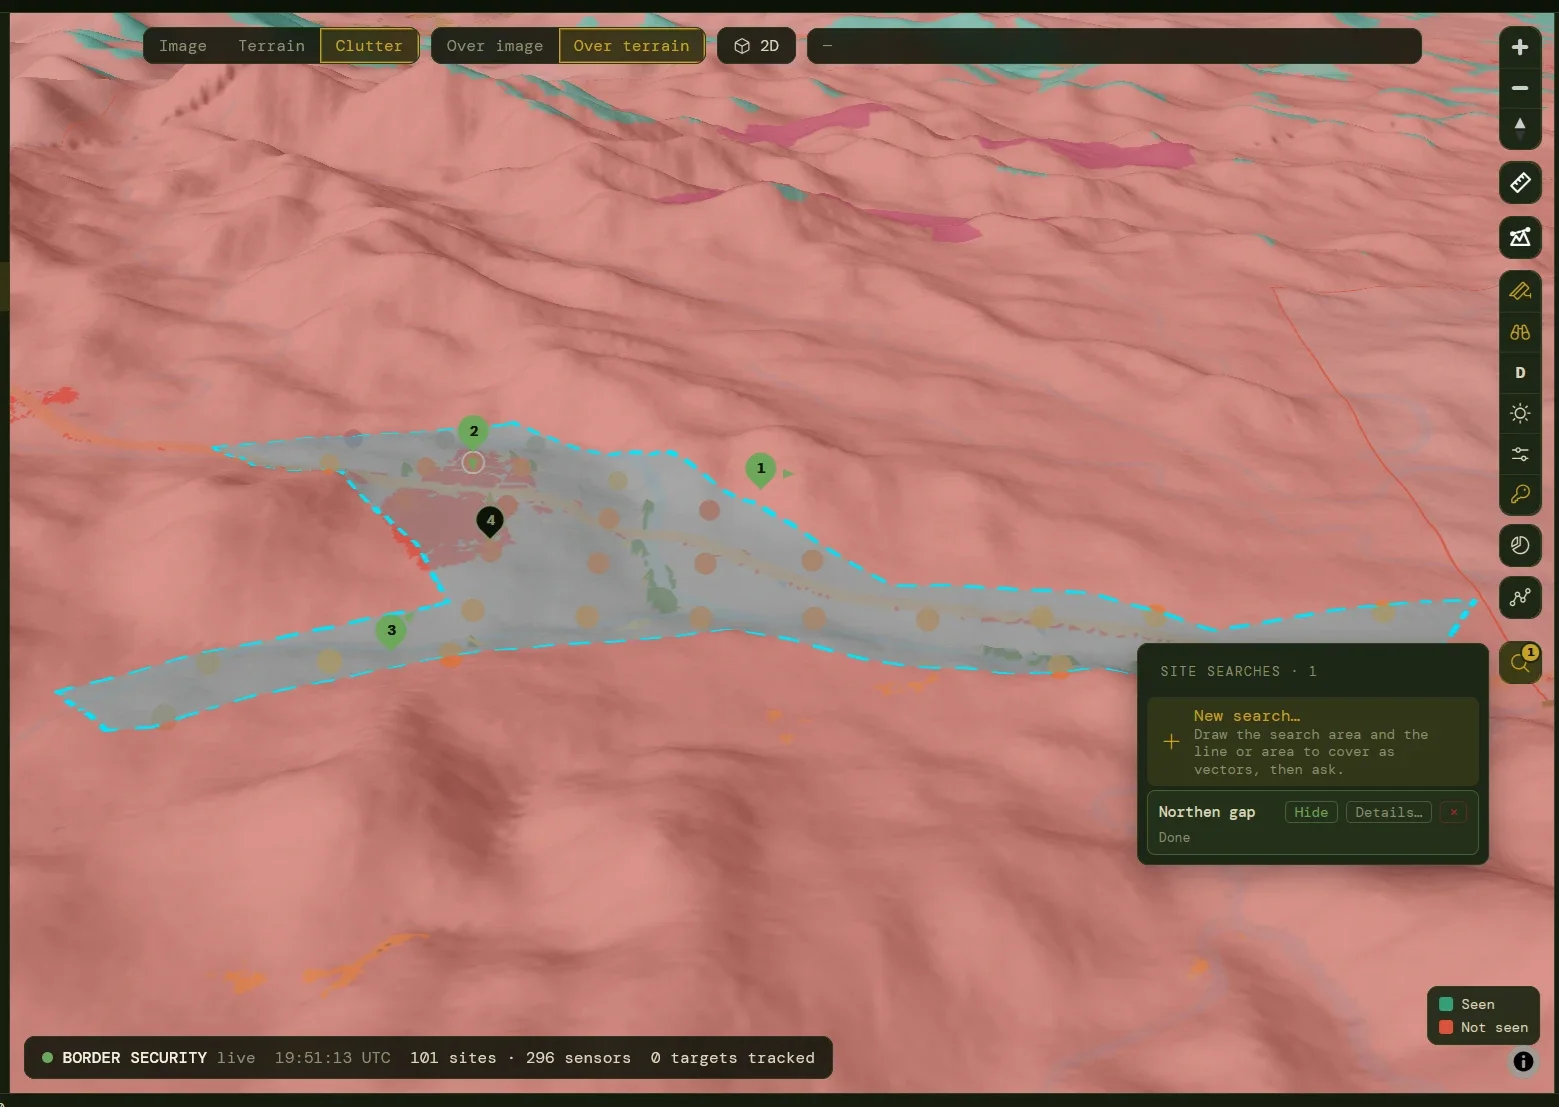
Result
Ranked sites, each one checked twice
The search scores a grid of candidates plus the high points of the terrain, then picks sites one at a time by the coverage each adds. The shortlist is recomputed sensor by sensor at 20–45 m, and the chosen sites are checked again at full resolution; a difference above 15% from the estimate is called out in the result.
- Numbered pins with mast height and bearing, and runner-up locations.
- Suitability dots show how good every candidate is, useful even without the final picks.
- Add to scenario in one click, so gain analysis and reports apply straight away.
- Limits are stated: terrain and clutter only, near-optimal rather than optimal; roads, power and land are as good as the vectors drawn.
04Anticipate what moves
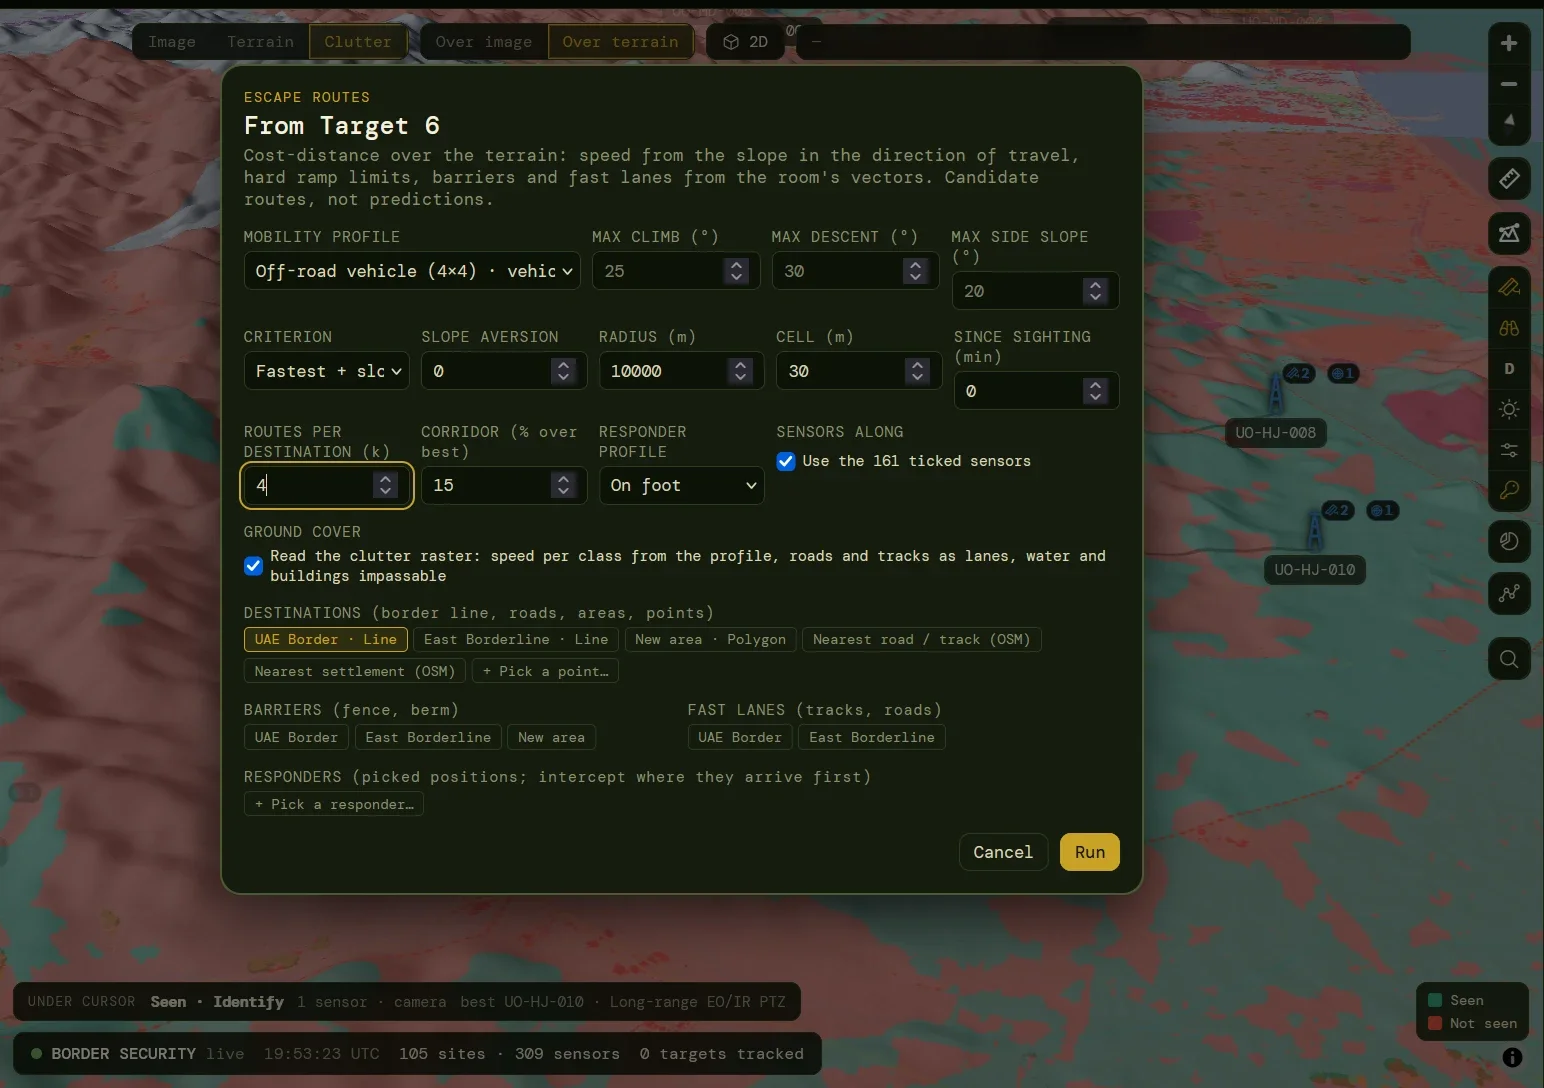
Escape routes
From any target or point: where can it go, and how fast?
A cost-distance run over the terrain, where speed depends on the slope in the direction of travel: uphill is not downhill. Choose a mobility profile and the dialog fills in its limits; override them for the run. Candidate routes, not predictions: people do not walk pure least-cost paths, and the report says so.
- Profiles for foot, off-road vehicle, motorbike and camel, editable, with hard limits on climb, descent and side slope.
- Criterion: fastest with slope, shortest, or an analyst-only stealthiest route that bends round the sensors.
- Destinations: the border line, areas, the nearest road or settlement, or picked points.
- Barriers and fast lanes from drawn vectors, and ground cover read from the clutter raster.
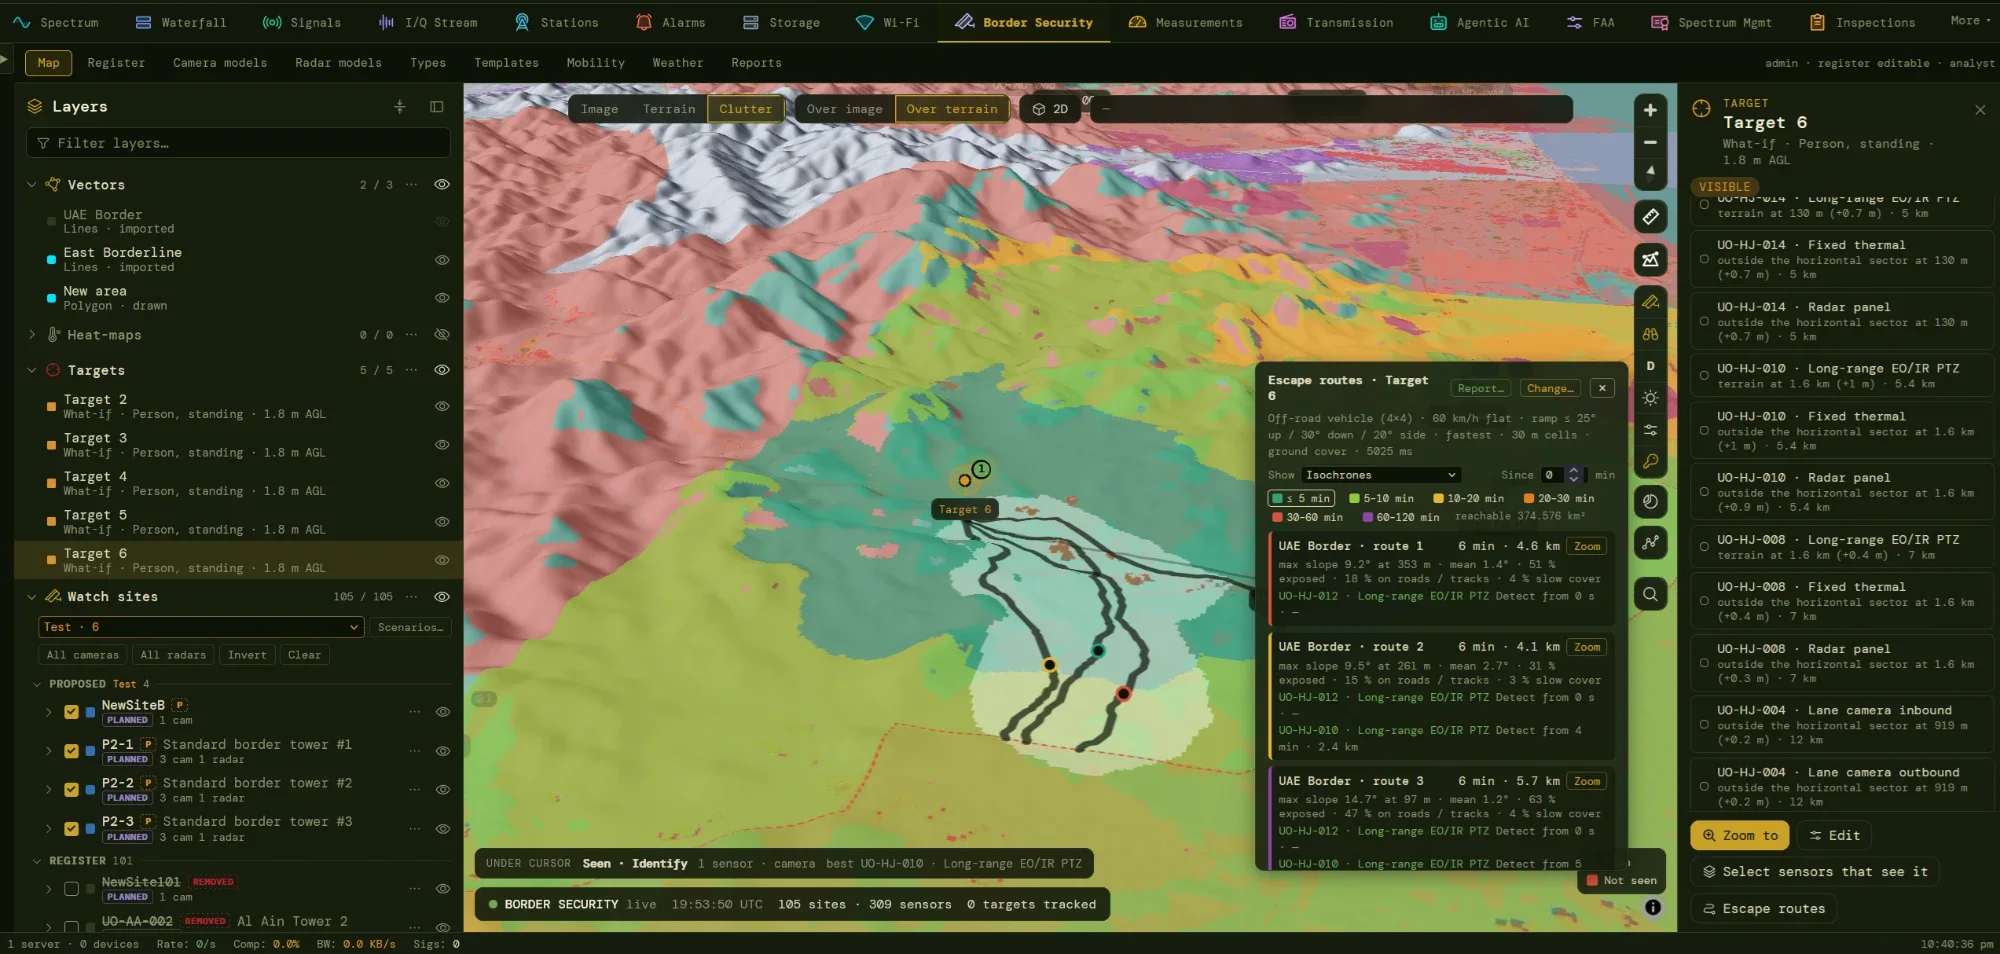
Isochrones and routes
Where can it be by now?
Colour bands show how far the target can have travelled in five, ten, twenty, thirty and more minutes, and the band for the time since the sighting is highlighted. Each route reports its time, length, steepest and average slope, and how much of it runs on roads, tracks or slow cover.
- Since-sighting clock reruns the picture as time passes.
- Sensors along each route, and when the target would enter each one’s coverage, so a post or PTZ can be pre-pointed.
- Who sees the target now, listed per sensor with the reason for each miss: outside the sector, terrain, range.
- Select sensors that see it ticks them in the tree and shows their coverage.
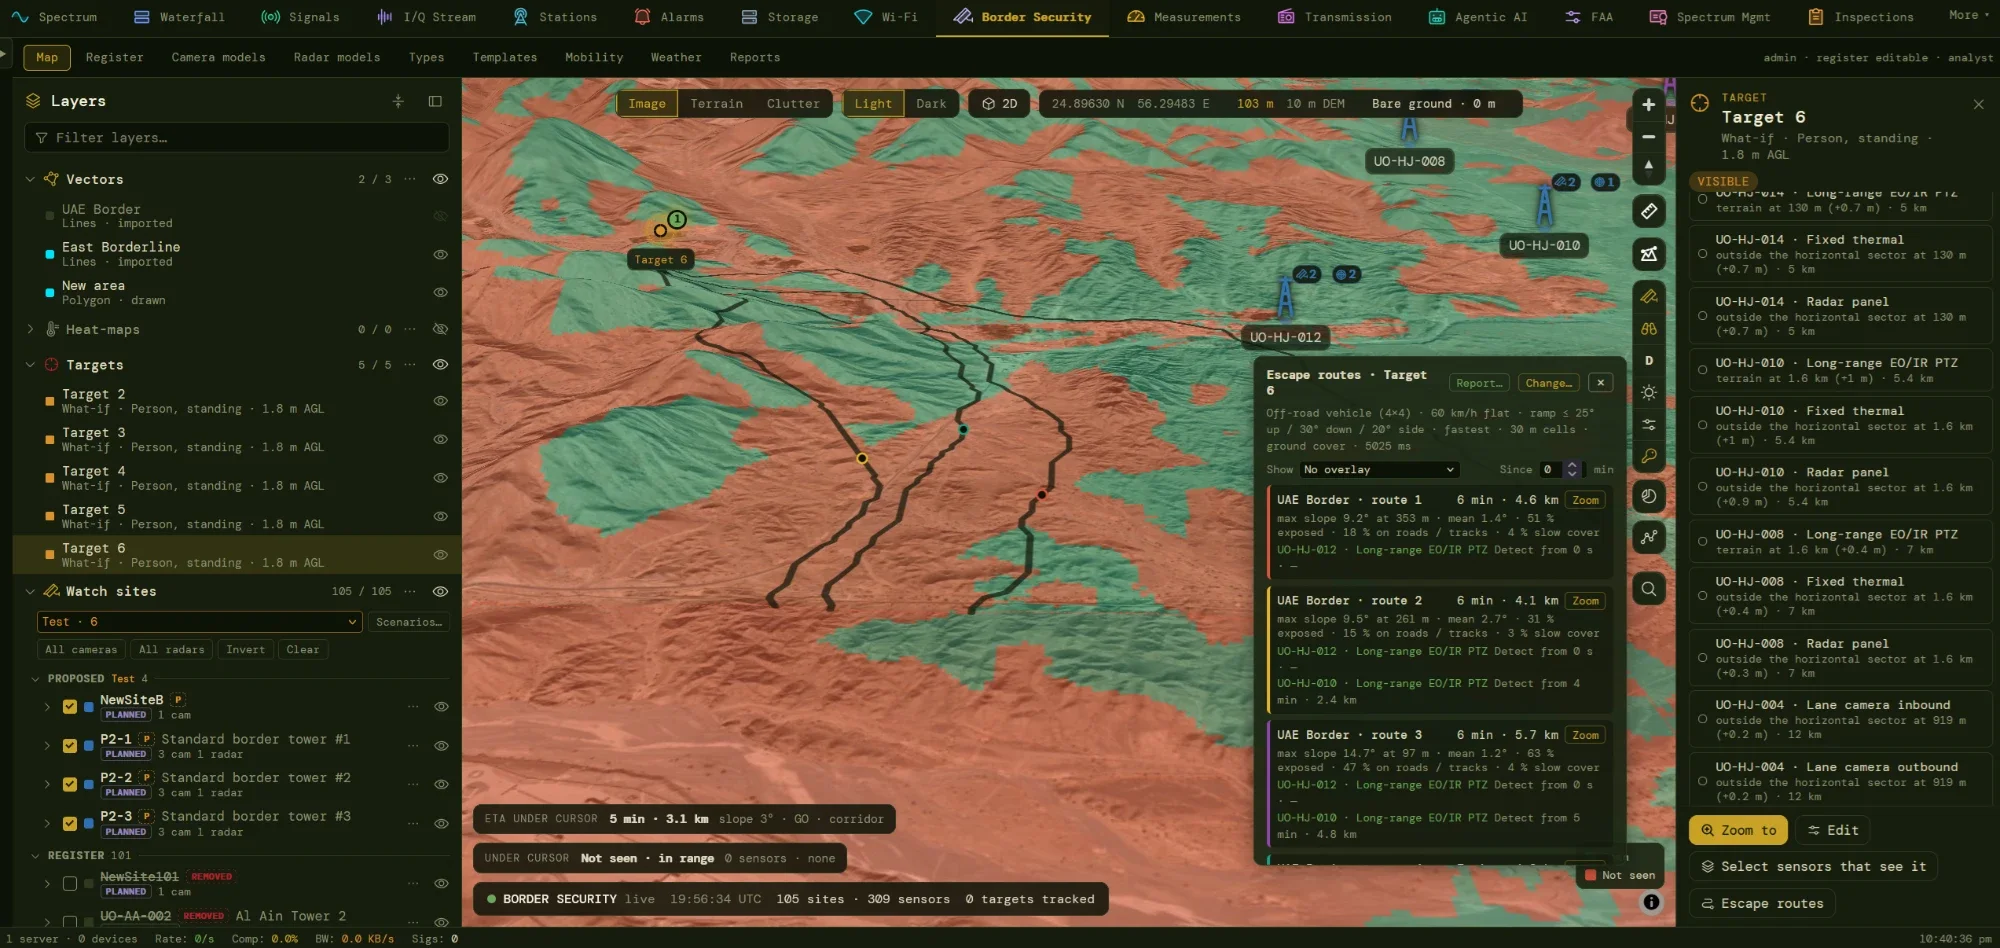
Routes on the ground
Diverse routes, a corridor, and a chip that answers as you move
Up to k routes per destination are drawn with time ticks, made diverse by penalising ground an earlier route already used. Beneath them, a corridor shows every cell within a chosen percentage of the best total time — a more honest picture than one line. Wherever the cursor rests, a chip gives the ETA, distance, slope and movement class.
- Interception from responder positions you enter or pick, such as patrol posts: where a responder arrives first, with ETAs.
- Choke points are found as the narrowest cross-section of the corridor.
- Exposure statistics and the stealthiest criterion need the analyst role.
- Seen / not seen underneath shows how much of each route a sensor can watch.
05Report and defend
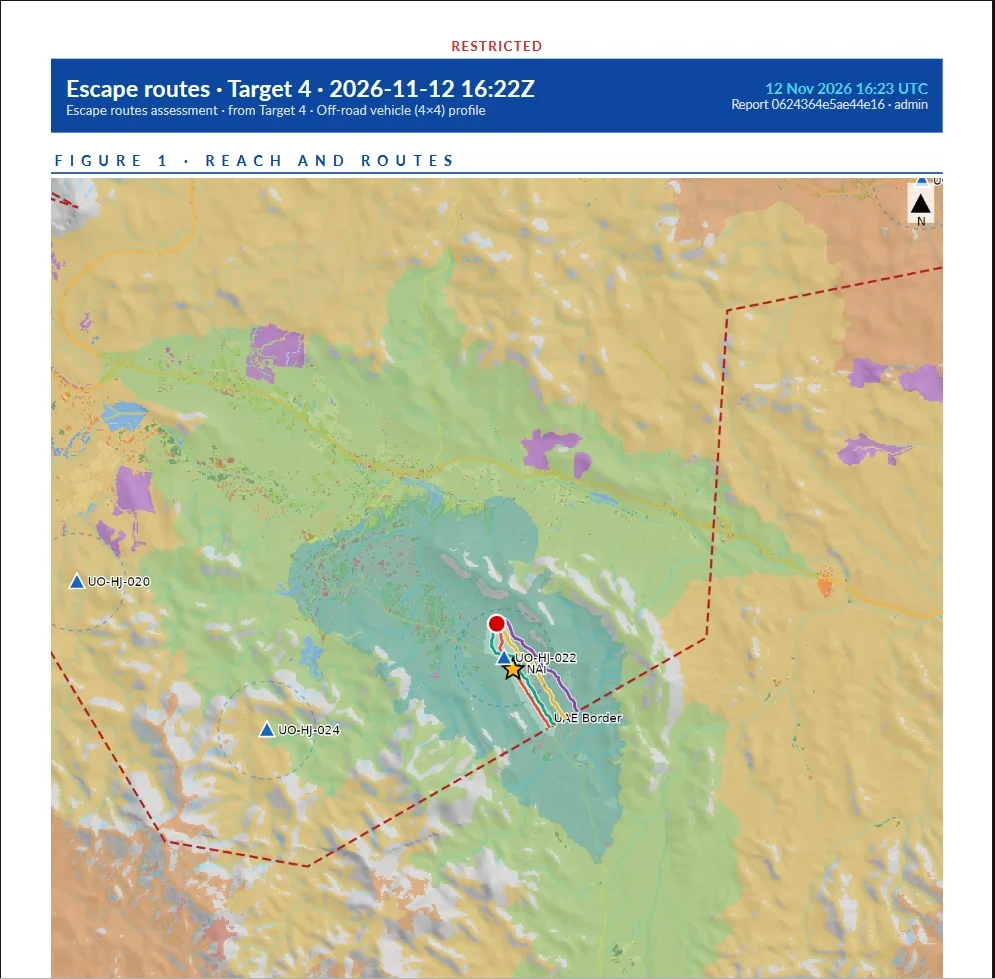
Reports
Reports that can leave the room
An escape-route run or a scenario becomes a PDF with the marking you choose printed on every page. The report opens with the bottom line (time to the border, time to vanish at a road or settlement, earliest warning, interception feasibility), then the figures, every route with a waypoint table in latitude and longitude and in UTM, the method, the data and its limits.
- Scenario reports show before and after maps, areas at each level, and a page per proposed site with its mast, sectors and ranges.
- Reports page keeps what you choose to keep, searchable by title, author, profile and marking.
- Analyst reports that carry gaps or exposure are restricted, watermarked and served to analysts only.
- Data credited on the page: AW3D30 terrain and ESA WorldCover land cover.
Sensors
Models Built From Datasheets, Tempered by Reality
Border towers are multi-sensor. A site carries any number of cameras and radars, each from a model in the library, each with its own pointing and limits. Nothing is a black box: the basis of every range is on screen, and unverified figures are marked as such.
Camera Models
Fixed or PTZ, with field of view, pan and tilt limits, and separate day and night channels (illuminator, laser or thermal), each with Detect, Recognise and Identify ranges. A calculator derives ranges from pixel density using IEC 62676-4 (2014 or 2025) or Johnson criteria for thermal, and a realism factor tempers datasheet figures that field tests rarely reach.
Radar Models
Rotating, electronically scanned or hybrid, with sectors, tilt, beamwidth and minimum range. Ranges are given per target class (person, vehicle, small UAS, boat); a class the datasheet omits is scaled from another by radar cross-section, and flagged as scaled. Several panels on one mast are simply several sensors.
One Geometry for Every Sensor
Boresight from true north, mechanical tilt, and horizontal and vertical sectors relative to both. Windows wrap through north correctly, rotating heads cover 360°, and the vertical test creates the near blind zone under a down-looking camera or a tilted radar face.
Types, Templates & Status
Site types and sensor types set marker and fan colours and glyphs. Status is held on both site and sensor, and the lower of the two applies, so a planned camera can sit on a commissioned tower. Kits of sensors are saved as site templates and placed as a whole.
Access
Two Grants, Separate on Purpose
Maps of where the border is watched are also maps of where it is not. Border Security therefore has two module roles, enforced on the server for every endpoint and map layer, not just hidden in the interface.
Border Security
Operators
Open the Border Security room and its own targets. Run coverage, overlap and best-sensor views; place a target and see who sees it; build scenarios and run site search; run fastest and shortest escape routes, isochrones and interception.
Administrator
Register keepers
The only role that edits the register. Creates and edits sites, sensors, models, types, templates, weather scenarios and mobility profiles; imports and exports CSV; promotes accepted proposals into the register.
Border Security · analysis
Analysts
Granted on top of the operator role. Border-line reports, gap lists, dead-ground maps, unique contribution, the stealthiest escape route and route exposure figures. Every output is watermarked RESTRICTED.
Audience
Who the Module Is For
Border Security assumes its users are planners, analysts and operations officers who need an answer quickly and who may be asked to defend it later. An operator ticks sensors and reads coverage, an administrator keeps the register, an analyst measures the gaps, and a reviewer reads a report.
- Programme planners deciding where towers, cameras and radars should be placed, and what each proposal adds
- Operations room staff who need to know which sensors see a target, and where it can go
- Register administrators responsible for sites, sensors, models, templates and reference data
- Analysts measuring border coverage, dead ground and the contribution of each site
- Procurement and review teams comparing baseline and proposal from exported reports
Basis
Built on Published Methods and Open Data
The methods are the ones the literature and the standards bodies use, so results can be explained to an auditor, and the data sources are named on the page and in the reports.
IEC 62676-4
Pixel density criteria
Johnson / TTP
Thermal range criteria
ITU-R P.1814-1
Fog and rain attenuation
WMO CIMO Guide
Koschmieder visibility
AW3D30 / SRTM / NASADEM
Elevation models
ESA WorldCover 2021
10 m land cover
OpenStreetMap
Roads, tracks, buildings
Tobler hiking function
Walking speed on slope
GO / SLOW-GO / NO-GO
Cross-country movement
Maximal covering location
Site search
CSV · KML · PDF
Exchange and reporting
Deployment
Runs Inside SESMA
No separate installation: the module runs on the SESMA application server, uses the same role model and audit logs, and shares nothing with the Mission Room.
Platform tier
Per-sensor grids are held in a disk cache with least-recently-used eviction, coverage compositions are held in memory and served as map tiles, and a background worker runs site searches with progress, estimated time and cancellation.
Data tier
Elevation tiles under the area of interest and, for clutter, land-cover files and an optional OpenStreetMap-enhanced raster, read in windows into a shared cache. Terrain and clutter versions are part of every cache key.
Performance
One sensor’s grid takes milliseconds to about a second; a fifty-sensor run takes seconds. A site search over 50 × 30 km at 250 m spacing is a matter of minutes, and an escape-route run with a 20 km radius at 30 m cells takes seconds.
Security posture
Two module roles, optional multi-factor authentication under central policy, and the same audit logs. Analysis endpoints and tile modes check both roles on the server, and outputs are watermarked.
Applications
Designed for Real Programmes
Border Security supports the decisions a surveillance programme makes over its life, from the first siting study to the weekly operations picture.
- Border Tower Network Planning
- Coverage Gap Analysis & Reporting
- Site Selection for New Towers
- Resilience: What if a Site Fails?
- Radar and Camera Mix Evaluation
- Weather and Night Capability Assessment
- Response Planning & Interception
- Proposal Comparison for Procurement
- Briefing Packs & Marked Reports
Roadmap
What Comes Next
Planned extensions, not part of the current release. They build on the same register and the same engine.
- Direction-finding and transmitter stations linked to watch sites
- Radar-to-camera cueing
- ONVIF and VMS link-out from the site record
- Live visibility for “as of now” runs
- Radar rain loss and rotating-radar revisit
- Backhaul line-of-sight check per site
Product
SESMA · Border Security
A module of Special Events Spectrum Management Automation. SESMA is a registered product of Resonix Solutions.